IntellaView Mobile App
The power of IntellaViewin the palm of your hand
Leave your desk, but not your switches. The IntellaView Mobile App works seamlessly with the IntellaView GUI to give you remote access to your network. Everything is a tap away.

Full-featured app
For teams on the go
Control your switches just like you would on your computer with IntellaView Mobile. Editing connections, receiving alerts, managing ports, or checking activity on a real-time dashboard — is just a tap away.


CURRENT STATUS
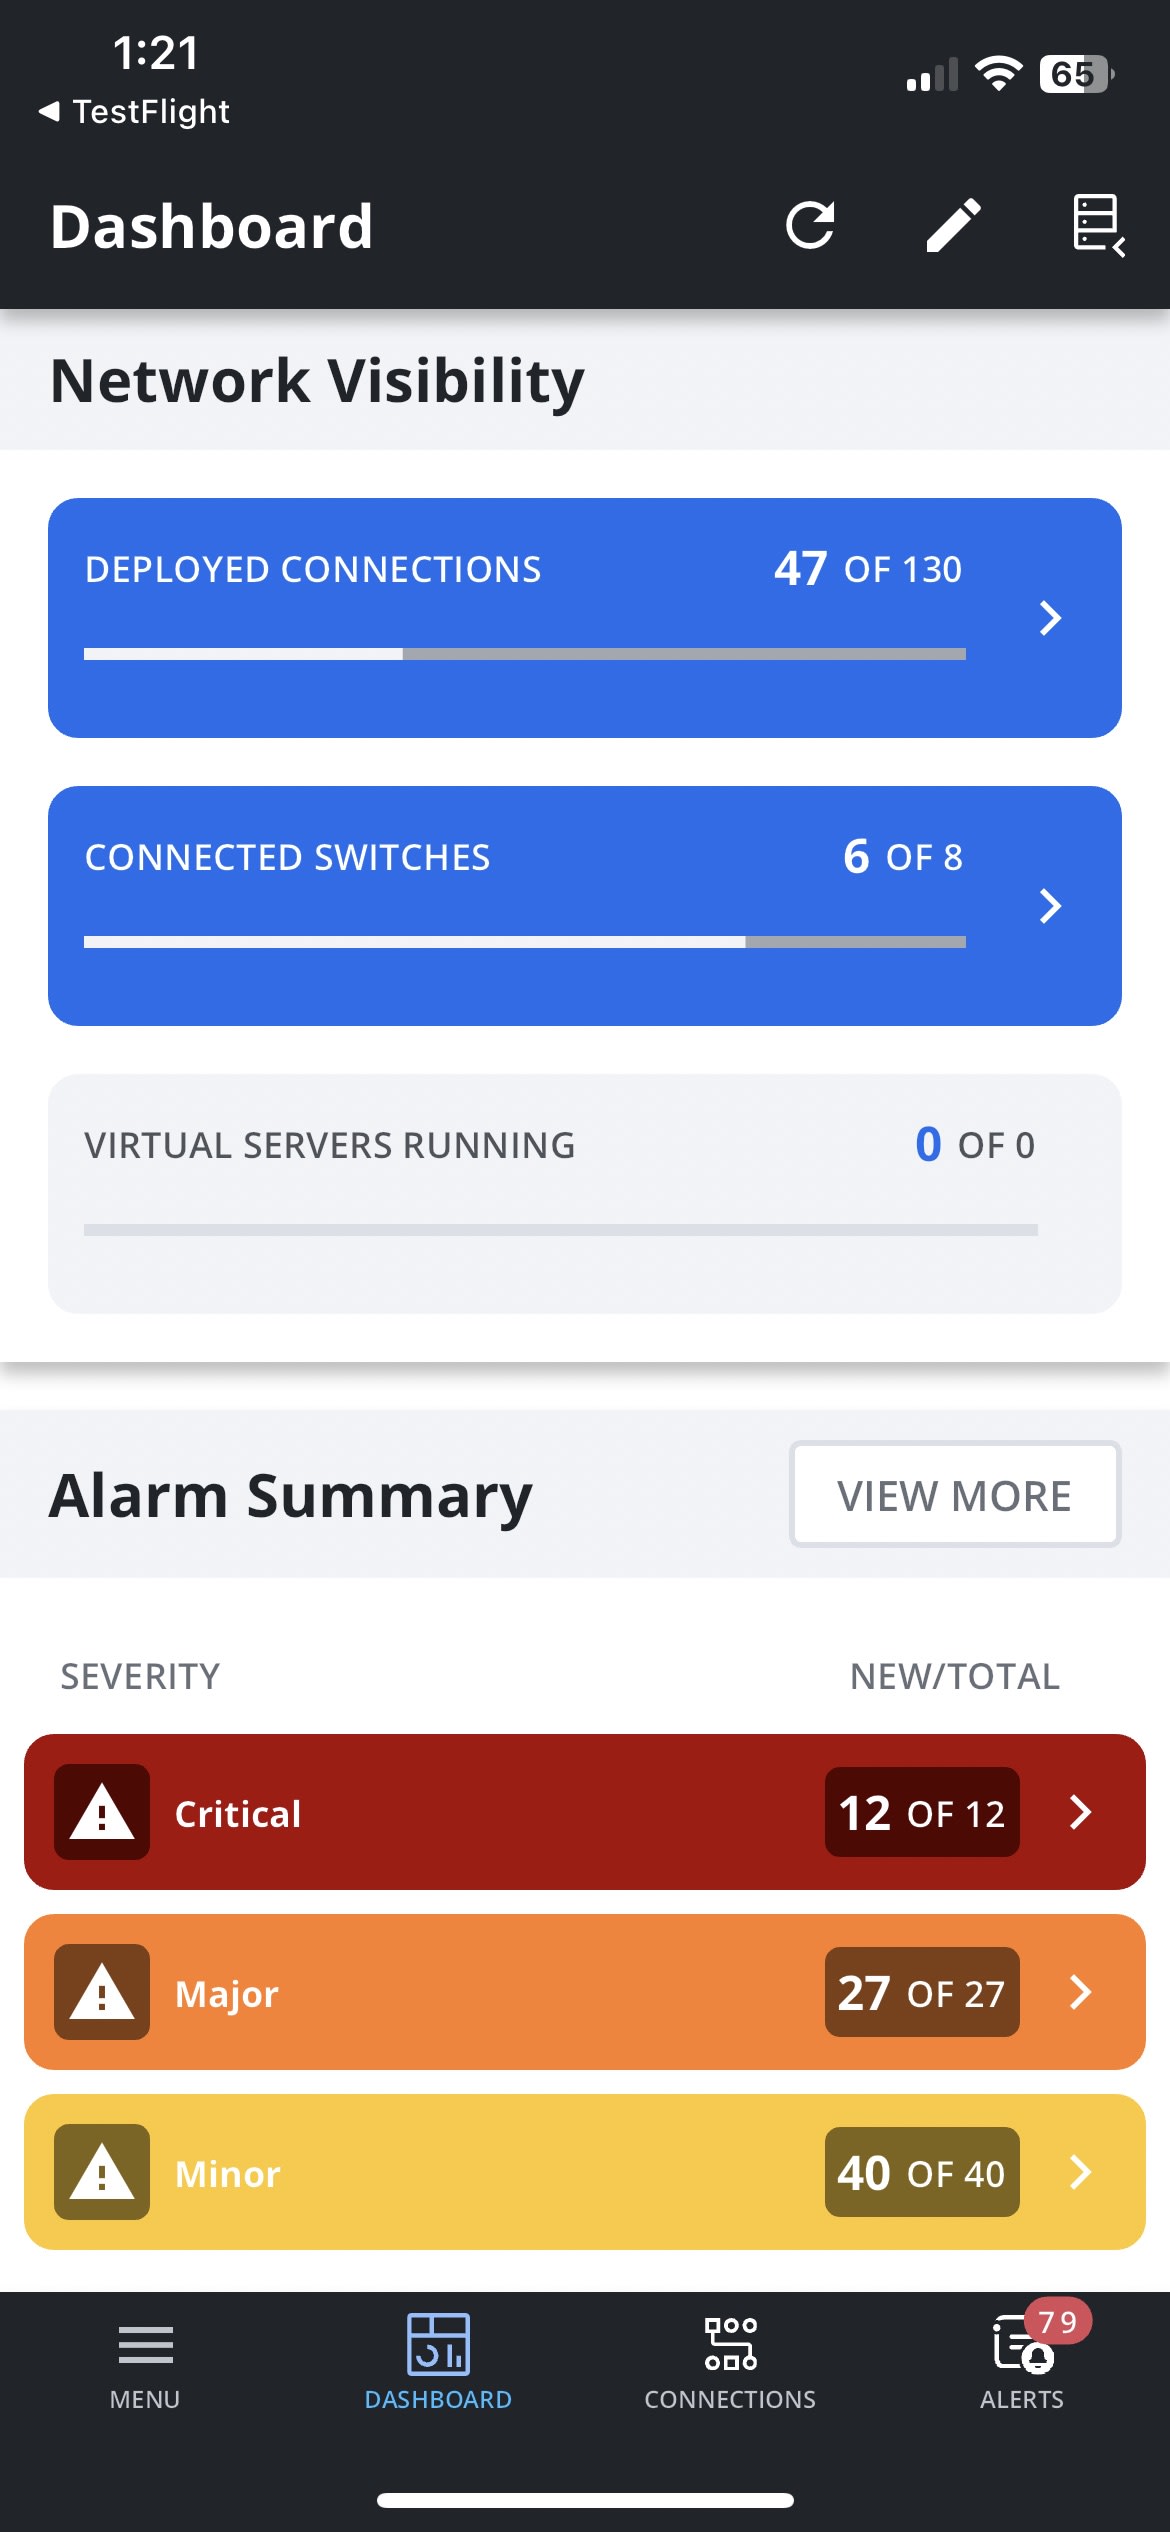
Enterprise-style dashboard with configurable widgets
When the IntellaView Mobile App is connected to the IntellaView Enterprise system, the app Dashboard is composed of widgets that can be added, removed, or reordered, just like on IntellaView Enterprise.
The Mobile App Dashboard widgets include Network Visibility, Alarm Summary, Port Summary, Events, Upcoming Tasks, and Online Enterprise Users.
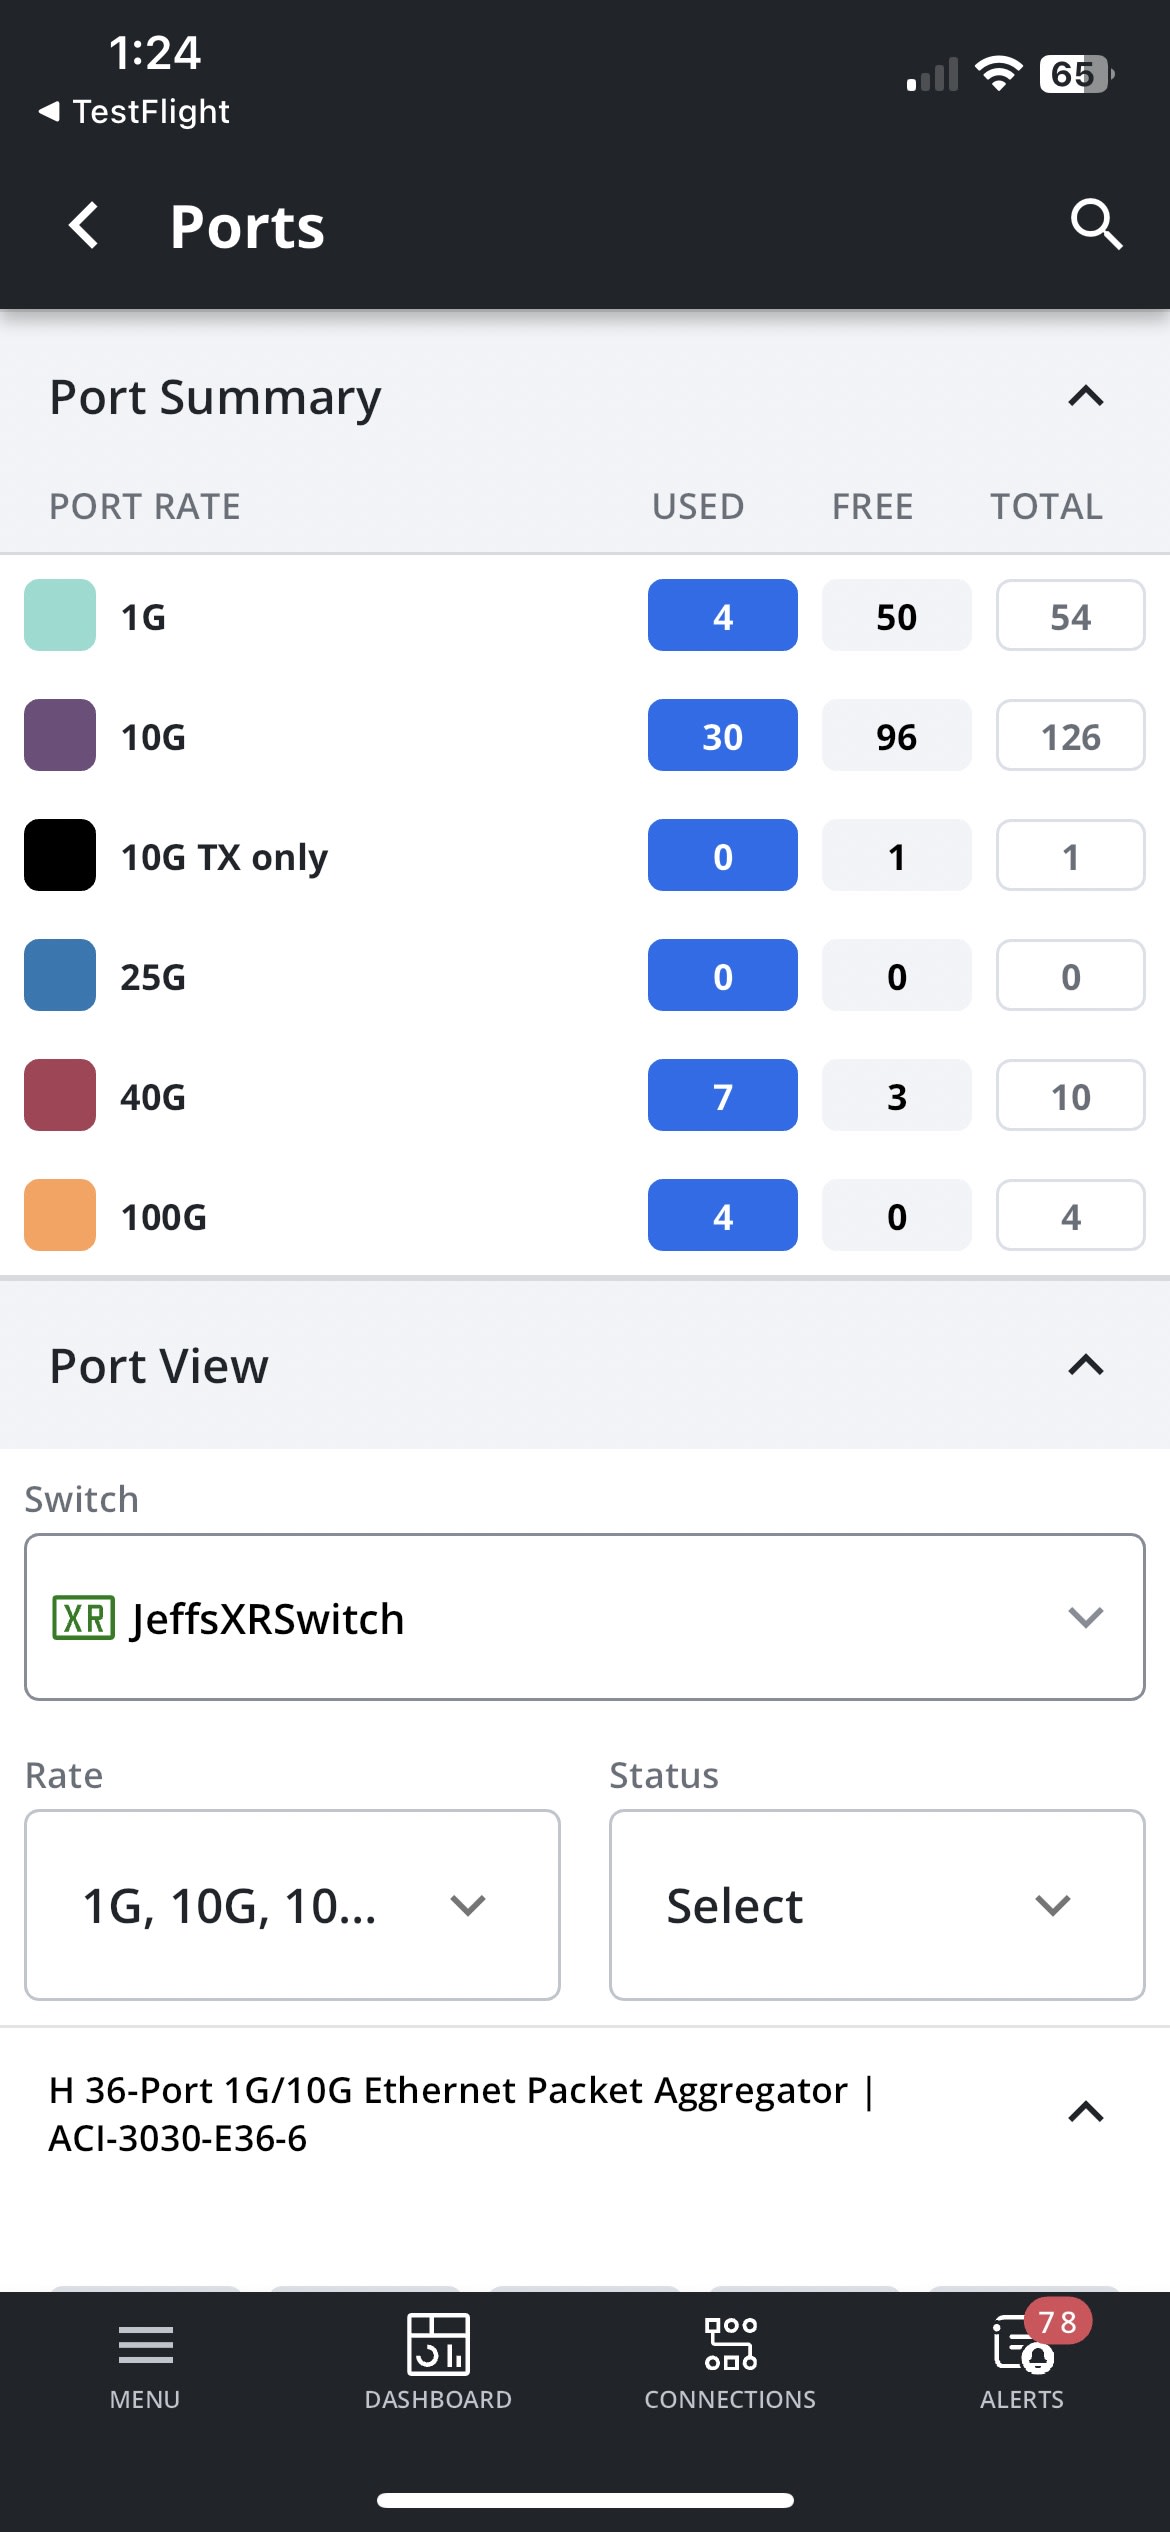
For example, the Alarm Summary widget displays the number of alarms by color and severity. The Port Summary displays the number of ports in use versus the total ports available at each port rate.
DEVICE SELECTION
Interact with relevant switches
The DEVICES screen allows users to select IntellaView Enterprise, Switches, or both. In addition, users can Pin Devices, thus saving their device selection across the application.
The Devices screen also includes a Filter by option that allows the user to select Severity (Critical, Major, Minor, or Information), Alert Type (Enterprise, Blade, Switch, Maintenance, Port, Traffic, or Other), or Status (Acknowledged or Masked) for displaying the data.
Connections and Trunks
Check any connection, port, or trunk
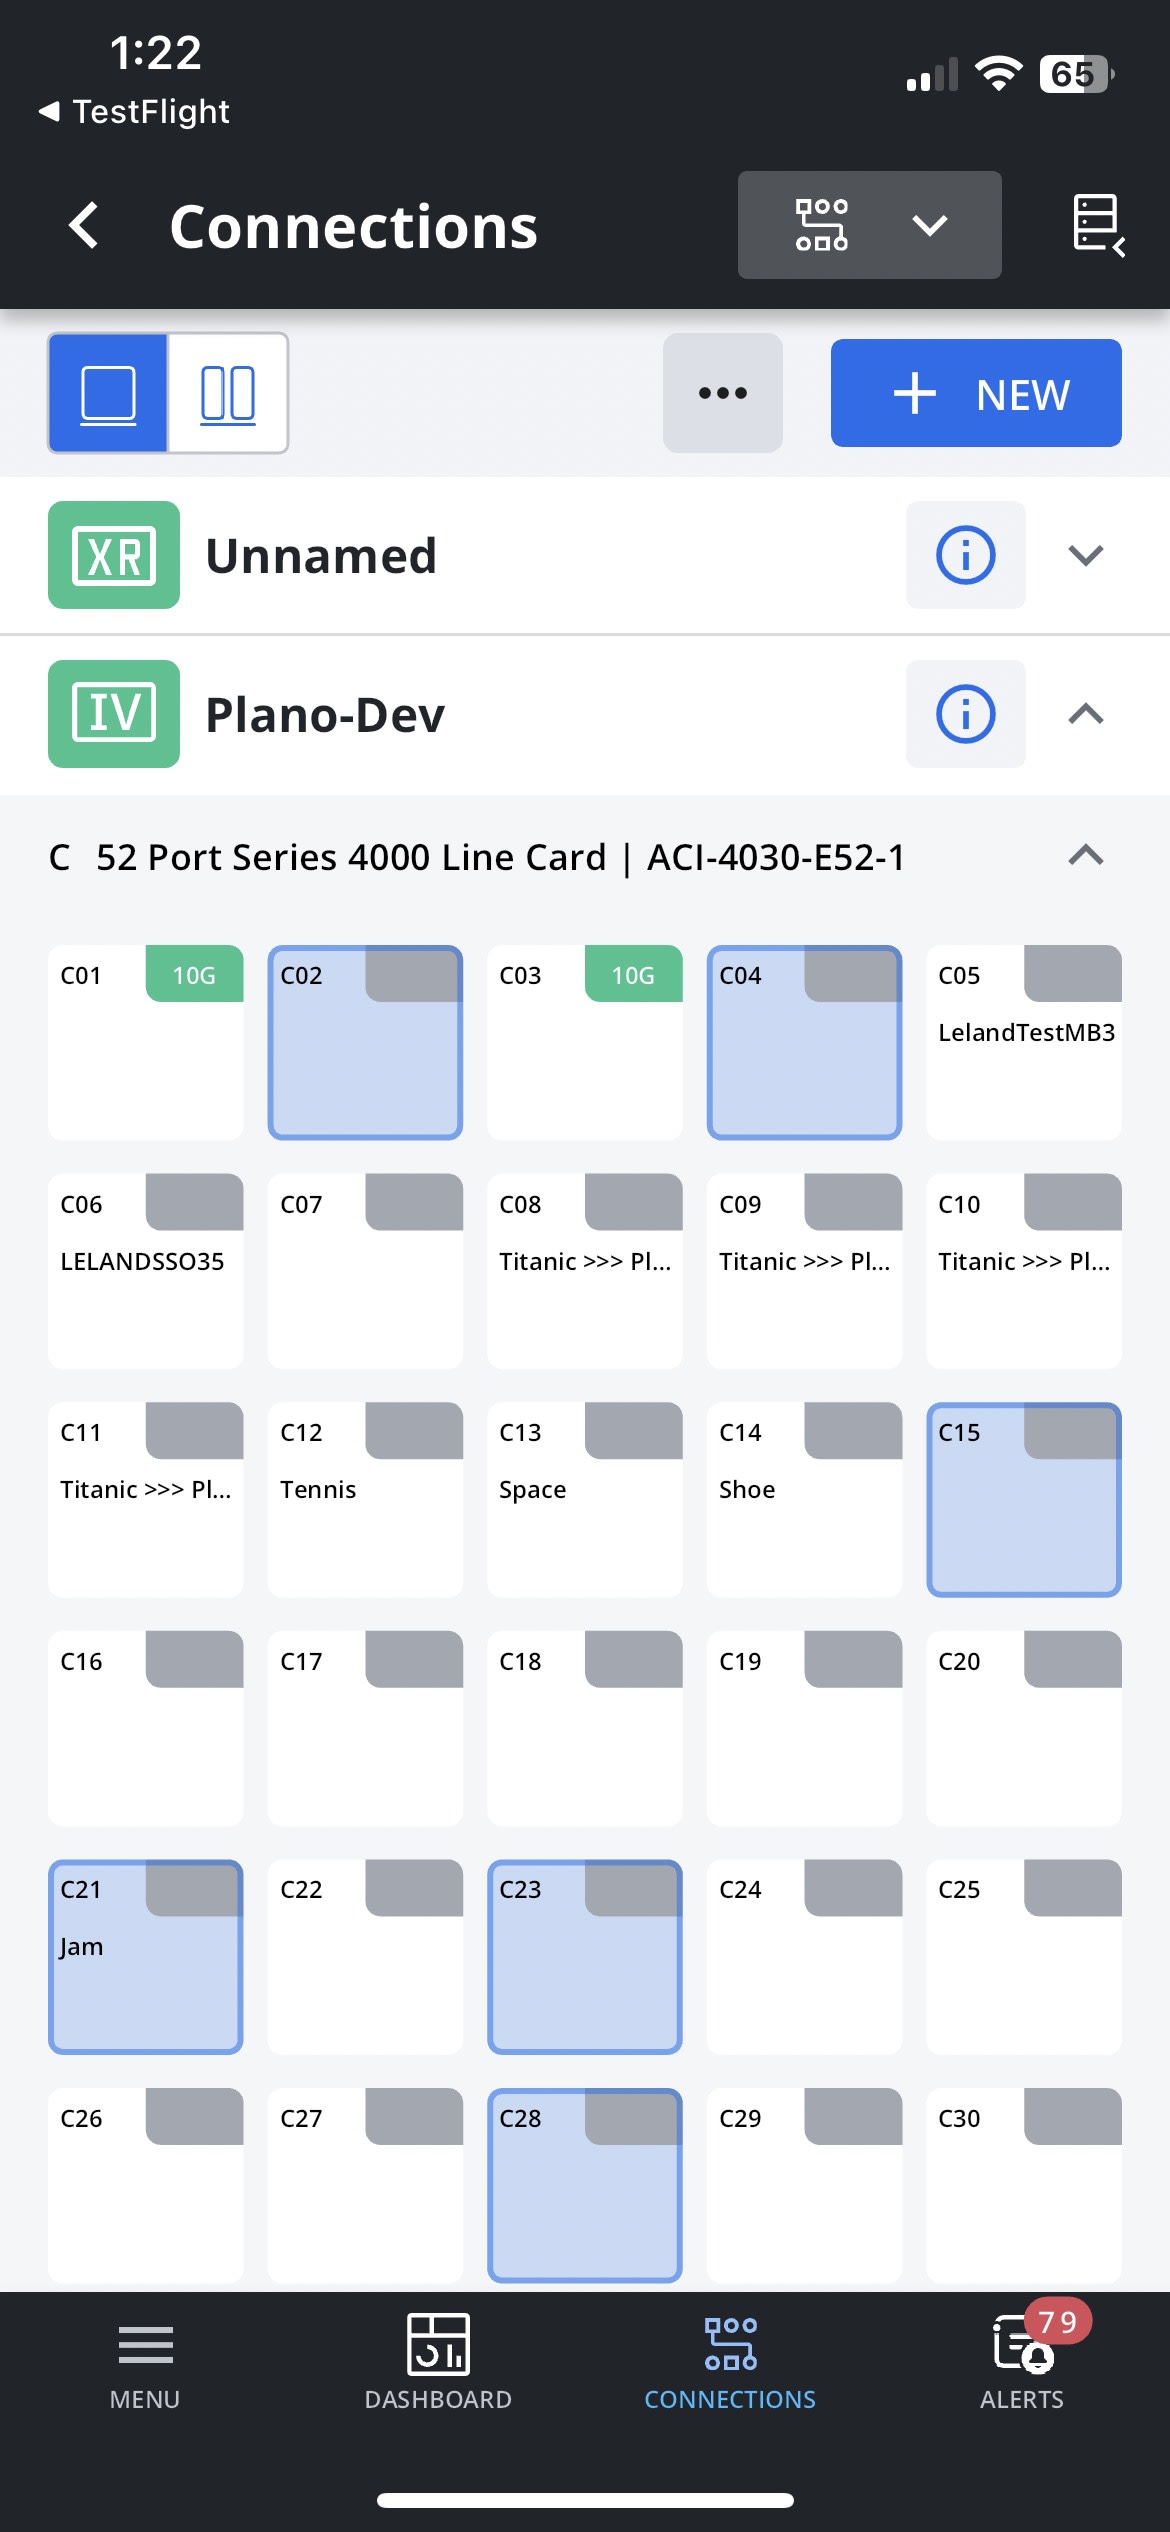
The CONNECTIONS LIST displays the Connection Name, Active status, Device name, Source Ports, Direction of traffic flow, Destination Ports, User, and any Load Balance Group (LBG) for each Connection on the selected device(s).
The TRUNKS LIST displays the Trunk Name, Type, SRC Switch, SRC Ports, Direction of traffic flow, name of the Dest Switch and Dest Ports, and the trunk Capacity.
The BROKEN TRUNKS LIST displays the Trunk Name, Switch, Ports, LBGs, and ACL Stacks for any broken trunks.
PORT VIEW
Get a summary of port activity
The PORT SUMMARY screen displays the selected switches in either a single column or in two columns (Data Sources and Destination Tools). Each switch can be expanded to display the blades, and each blade can be expanded to display the ports. Ports can be moved back and forth between Data Sources and Destination Tools.
Users also have the option of quickly creating a New Connection, a New Duplex Connection, a New Trunk Connection, or a New Shared Trunk Connection.
SCHEDULER
See scheduled events — past and future
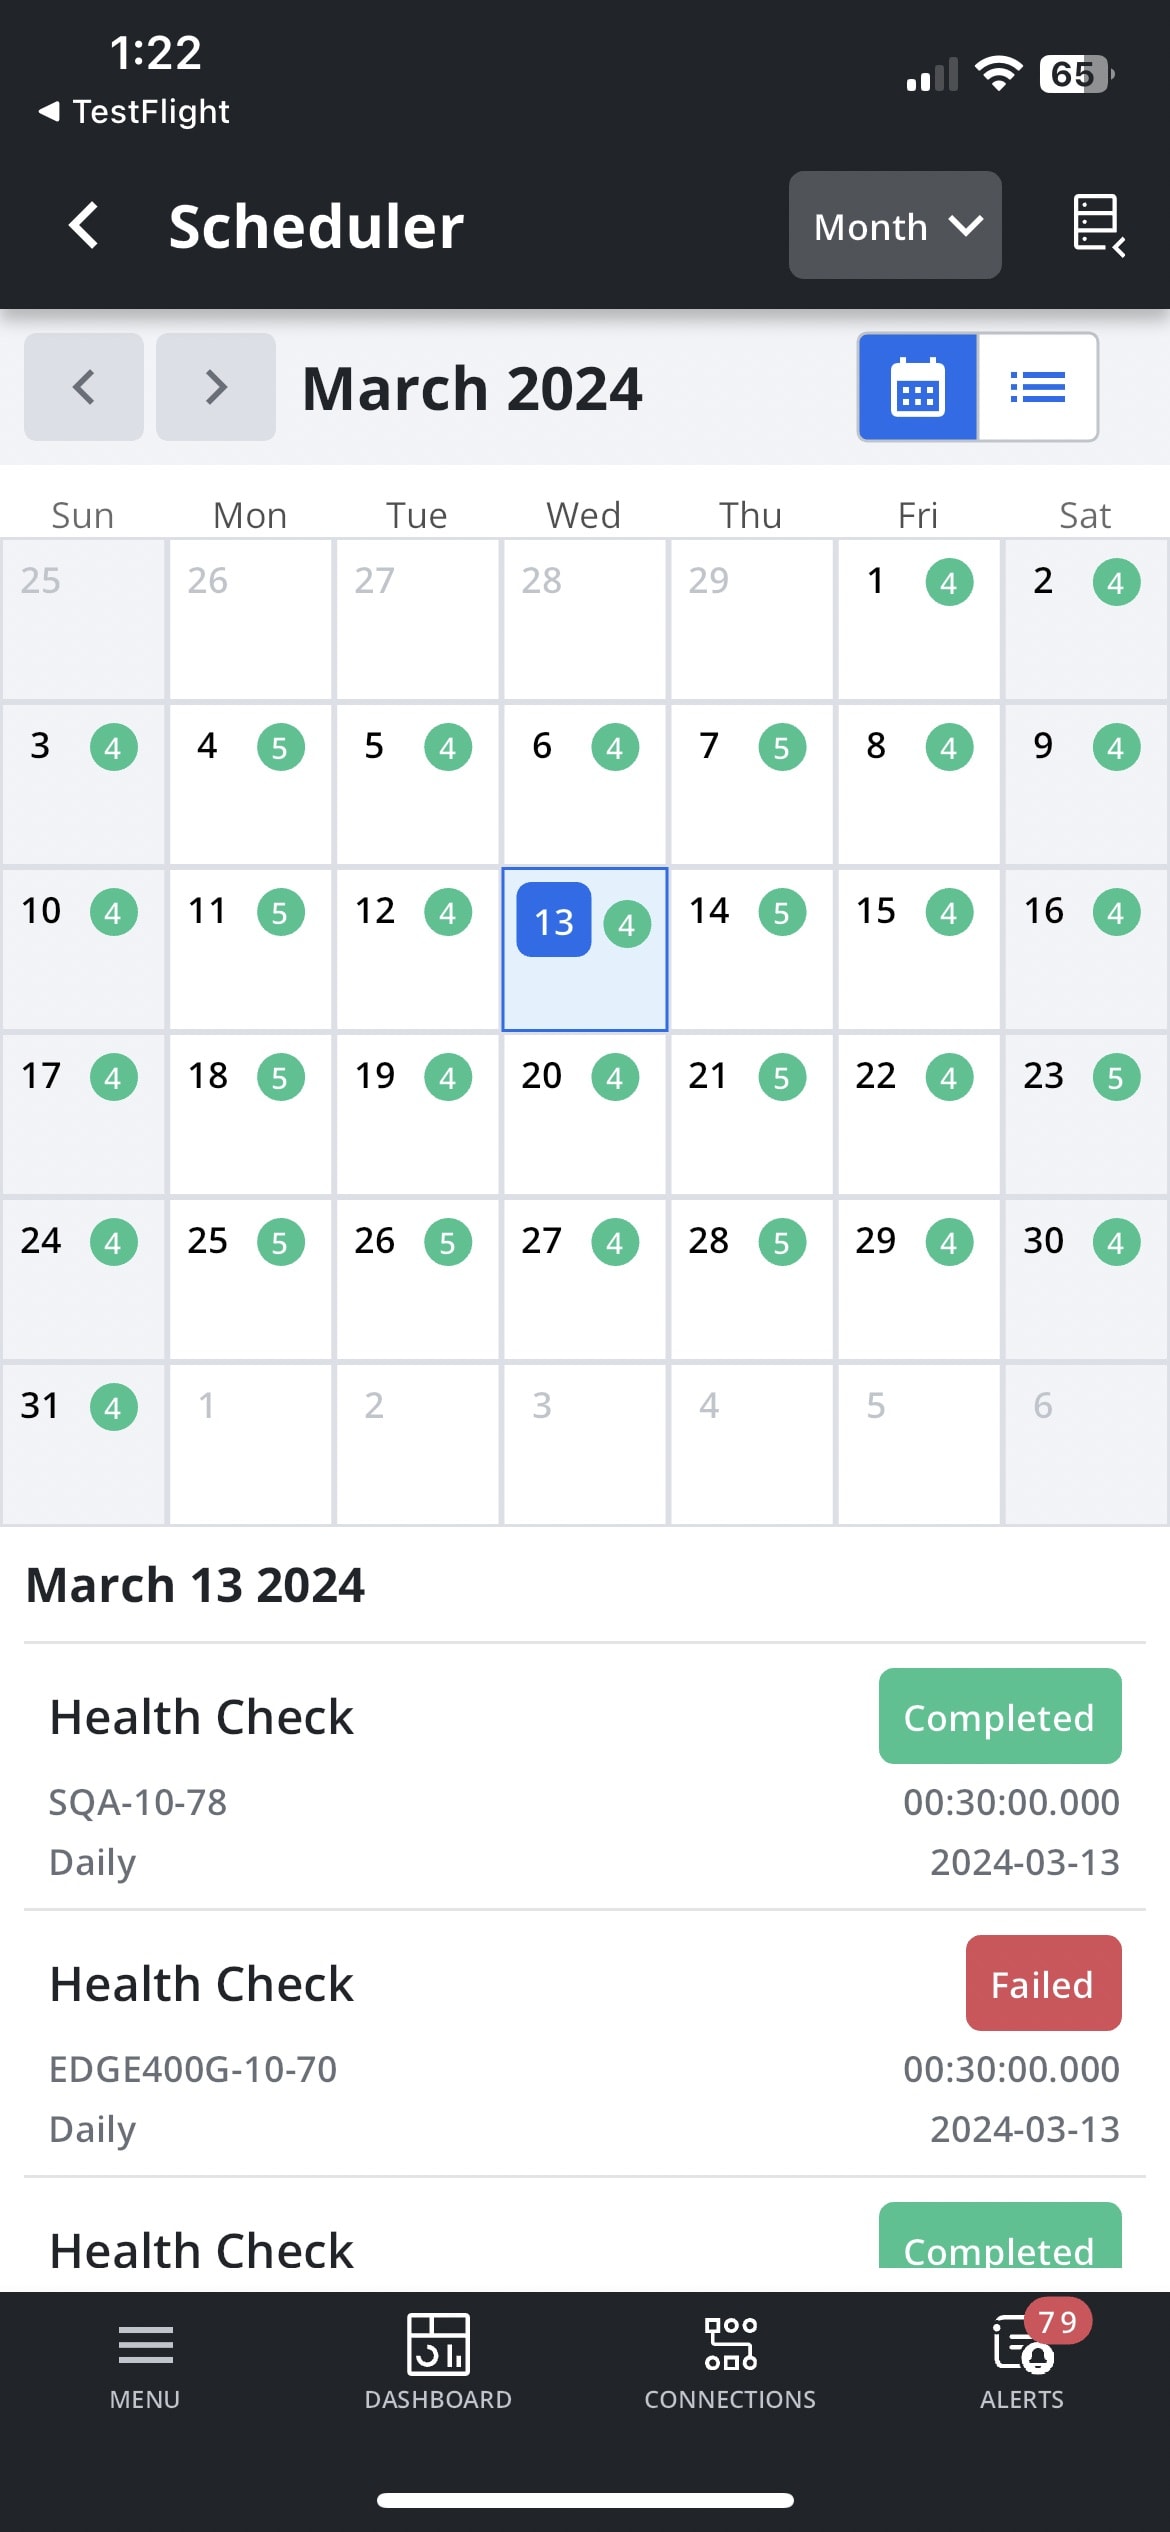
The SCHEDULER screen displays a read-only view of events scheduled for the current month in either a Calendar or a List format. The Devices menu allows the desired device(s) to be selected. Backward and forward arrows allow the schedule to be moved backward or forward one month at a time.
STATISTICS
Review stats from the last two years
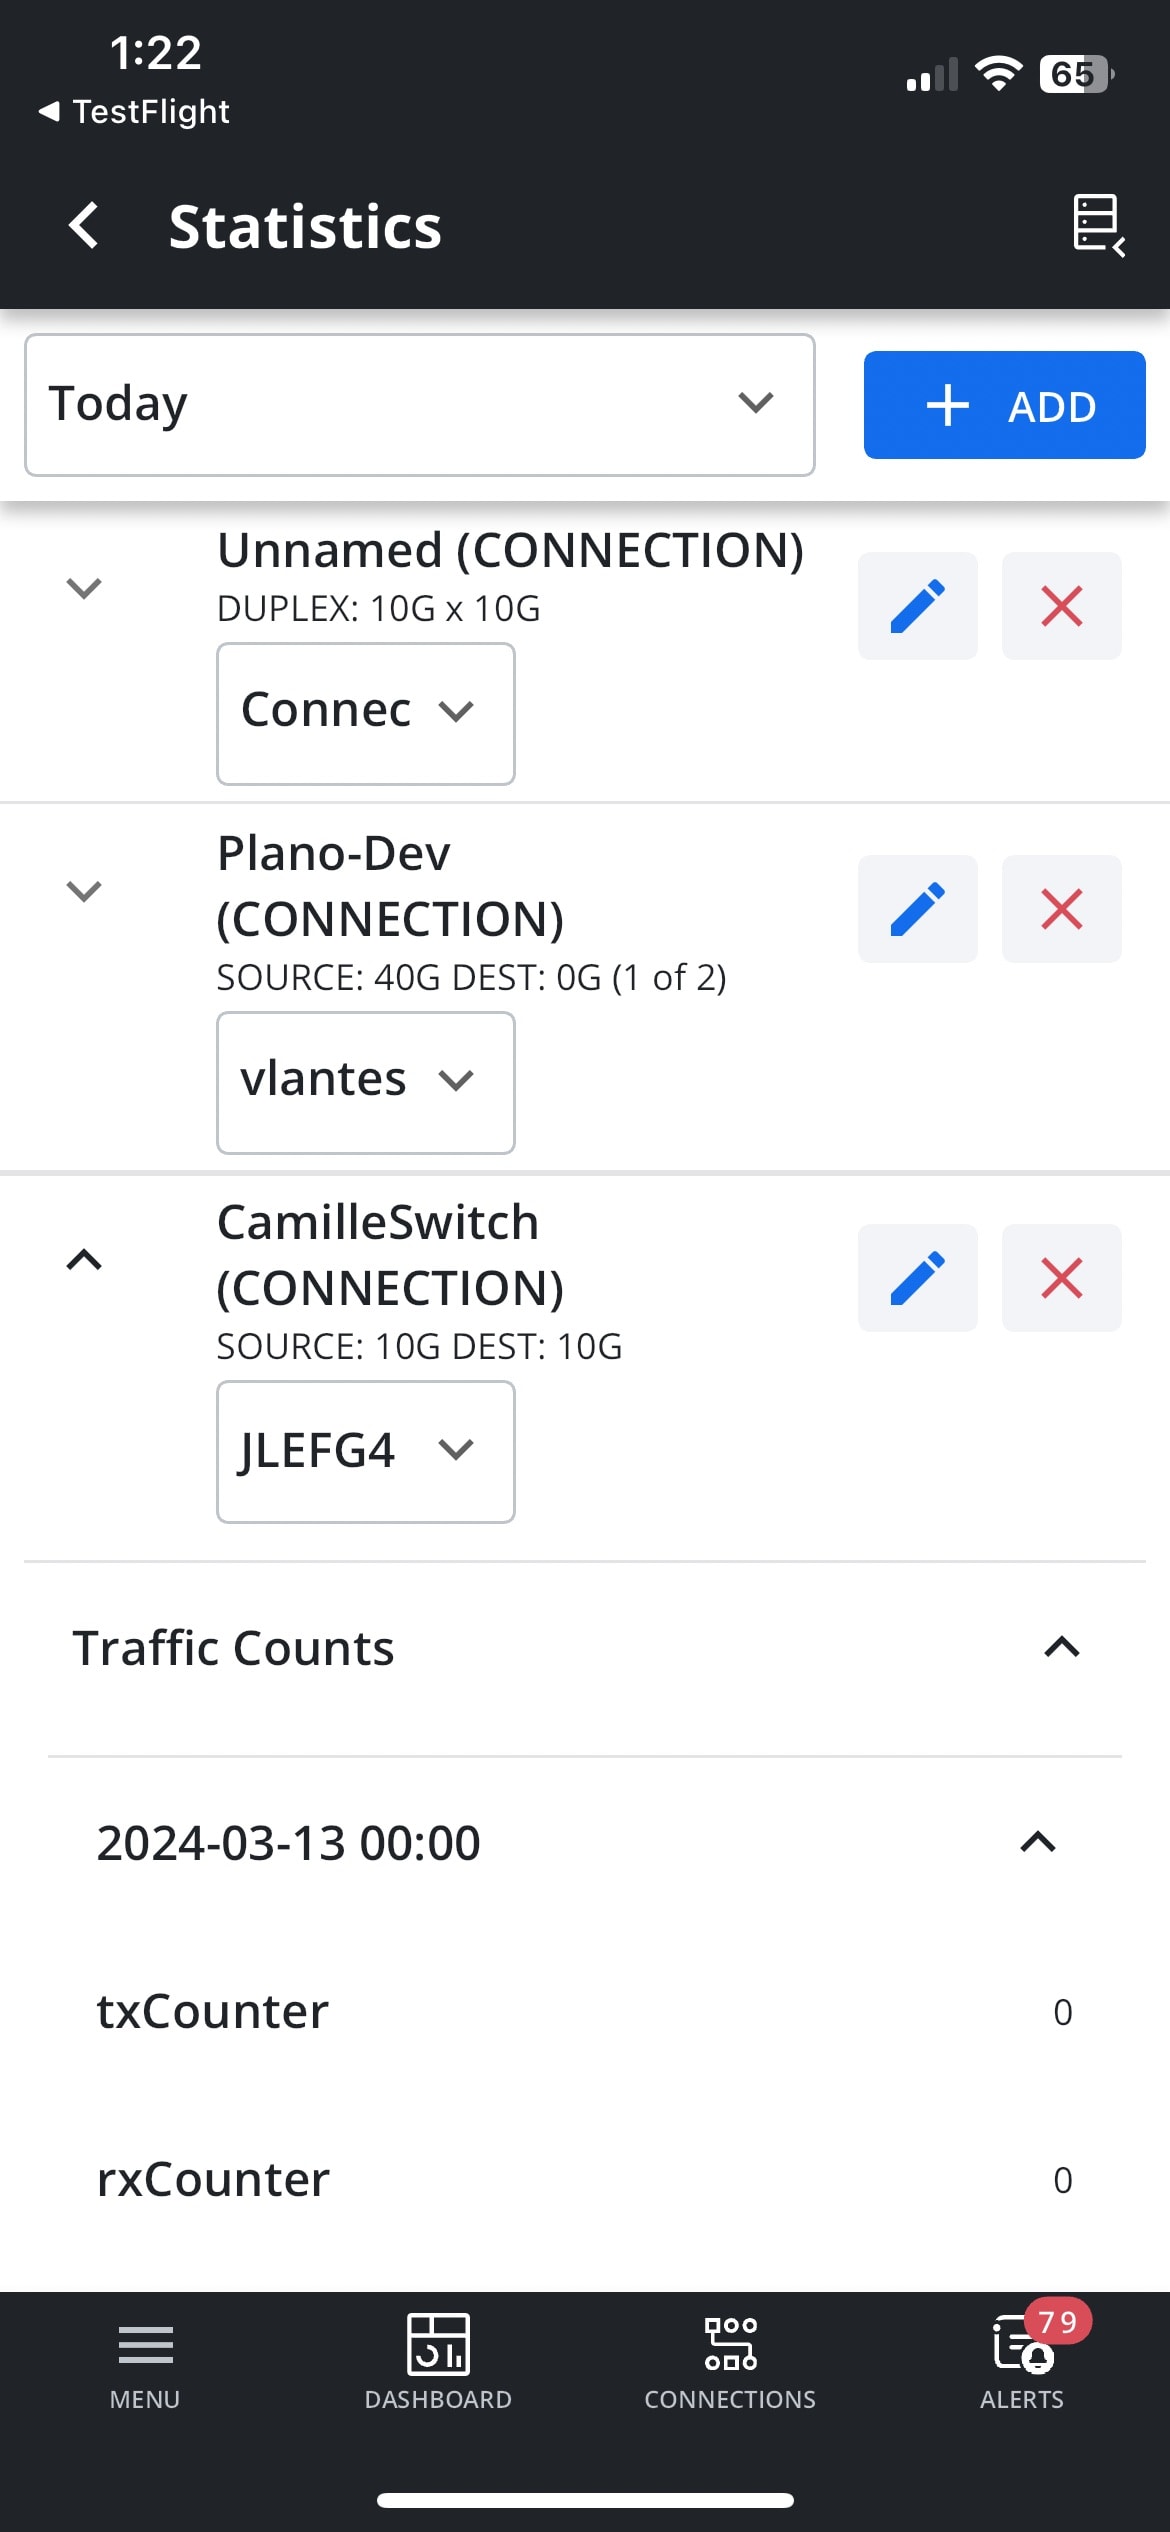
The STATISTICS screen displays traffic statistics for user-defined time periods ranging from the Last 30 Minutes to the Last 2 Years. The Devices menu allows the desired device(s) to be selected, and ports and Connections to be added.
The available statistics are Traffic Overview and Counts, Error Overview and Counts, Packet Size Overview and Counts, and Packet Type Overview and Counts for each switch selected.
SWITCHES SCREEN
Interact with switches connected to IntellaView Enterprise
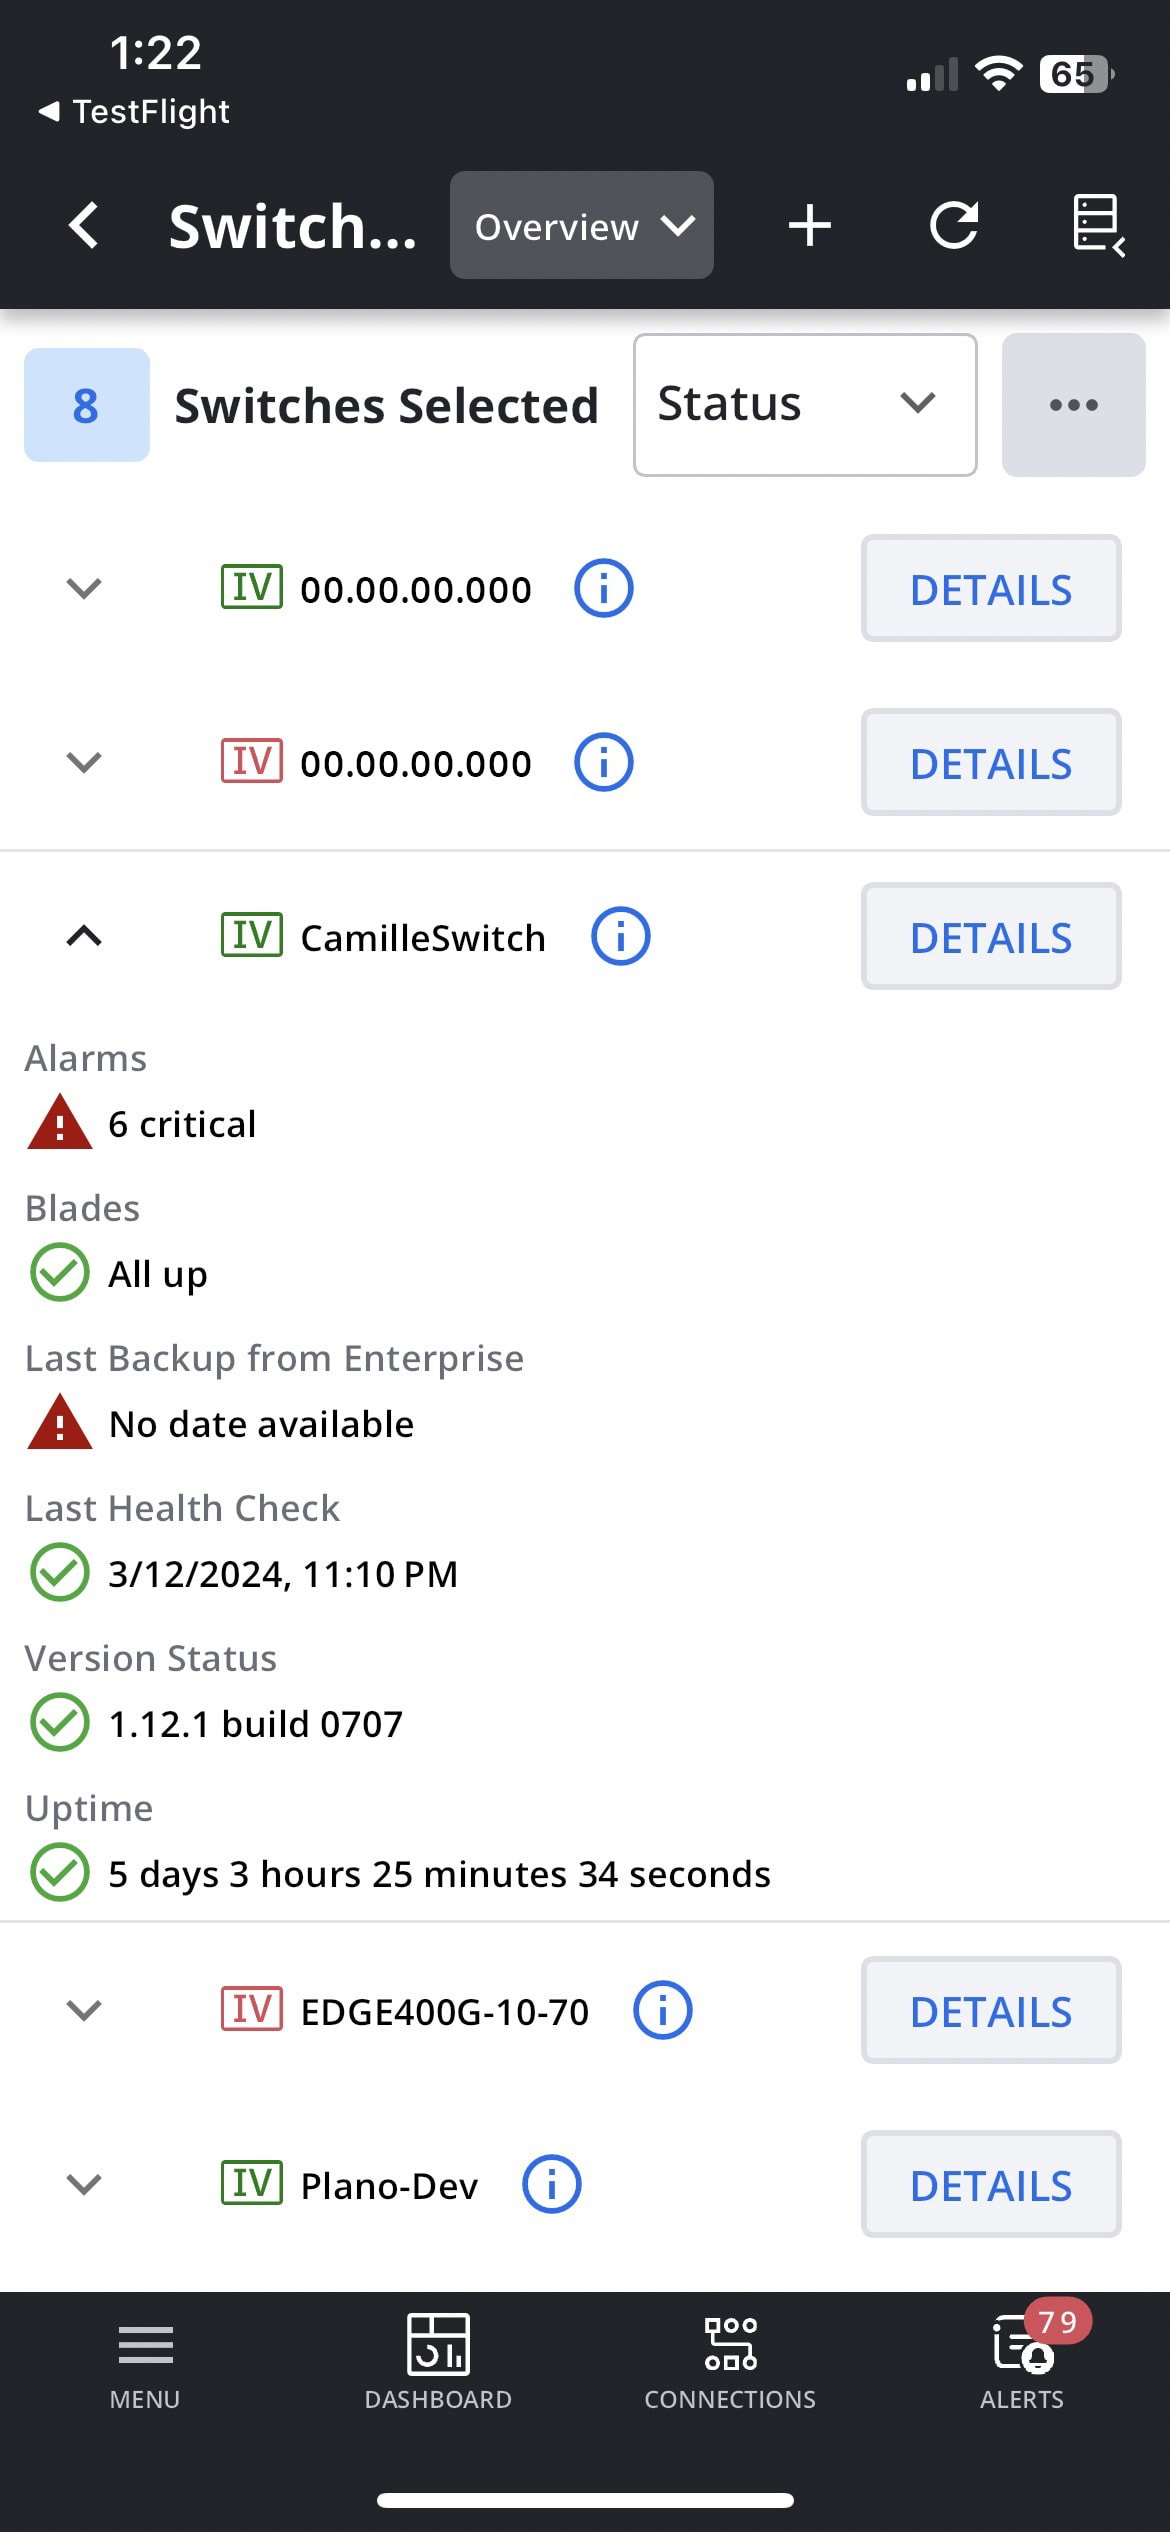
The SWITCHES OVERVIEW screen displays the devices connected to the IntellaView Enterprise system. Each device can then be expanded to View More or to see Switch Information.
In the upper right corner of the Overview screen, there is a drop-down menu with Status, About, Port, Traffic, Events, and Schedule along with other options to Remove switches, Update credentials for selected switches, Update Description for selected switches, and Reboot chassis for selected switches, and more.
You can also toggle to different views for the Switch Dashboard and Port Summary screens.
FIREBASE NOTIFICATIONS
Receive alarm messages on-the-go
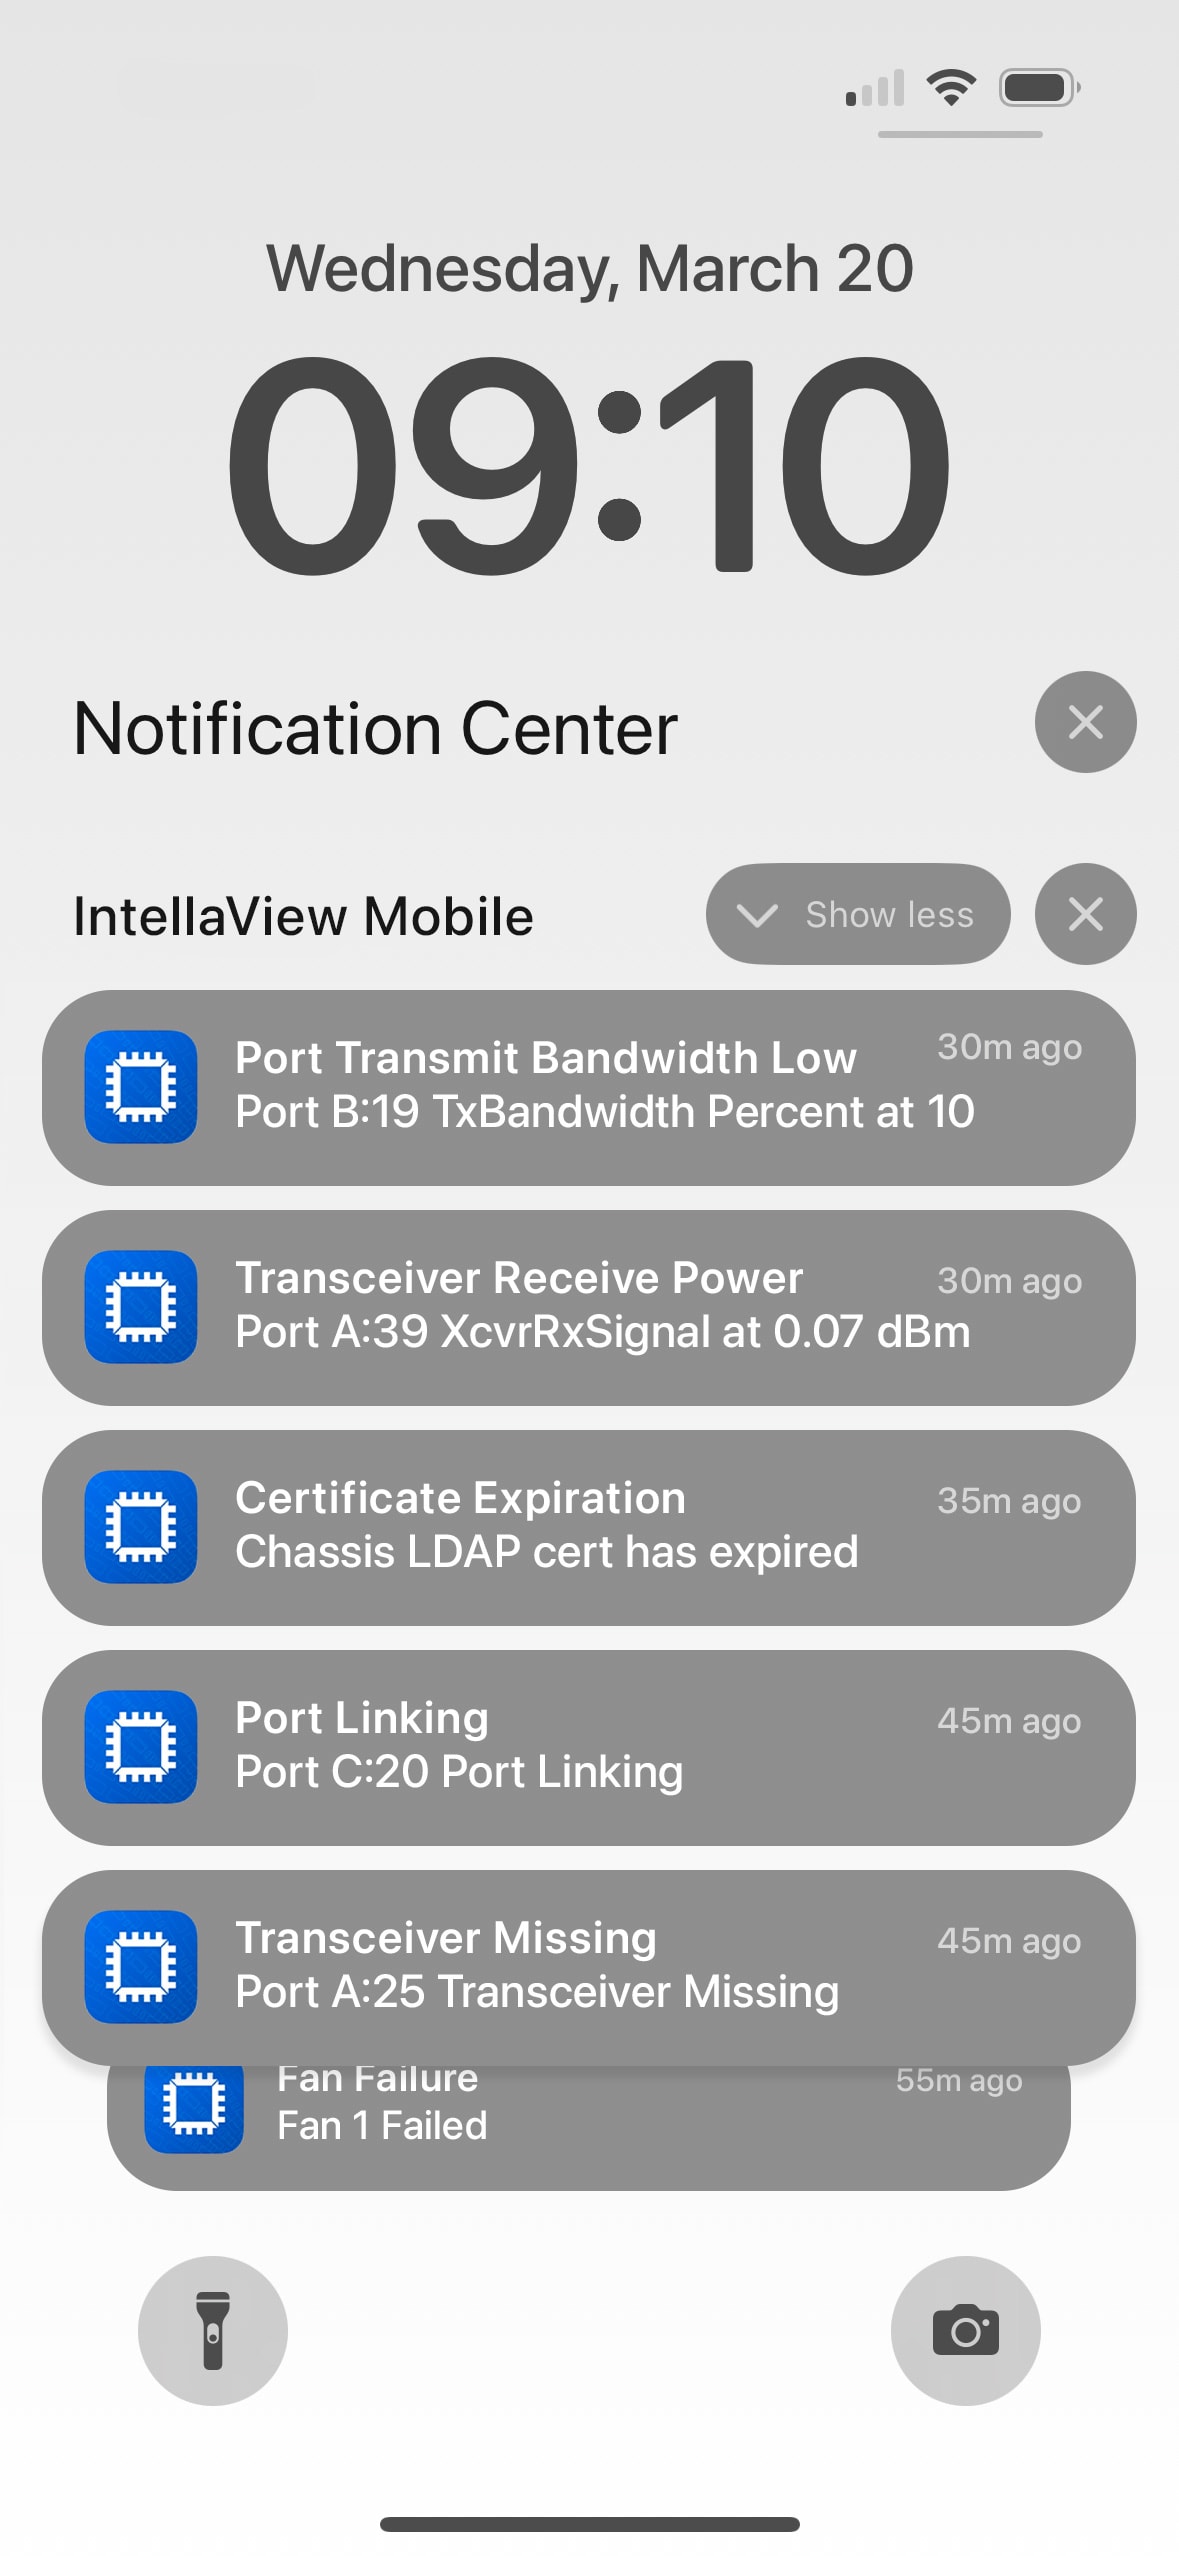
When users log out of a switch, they can still receive notifications when certain types of alarms occur. With the latest IntellaView Mobile App release, users can receive a notification via Firebase Cloud Messaging on a mobile device when an alarm occurs on the switch, even if the user is logged out.
Note: The network must be configured to allow the switch to reach Firebase Cloud servers, and External Notifications must be enabled on the switch.
CUSTOMIZABLE NAVIGATION BAR AND MENU
Quickly access data of interest from any screen
The Navigation Bar at the bottom of each IntellaView Mobile App screen always displays the Menu and Switches icons. In addition, users can customize the bar with additional icons: Scheduler, Statistics, Users, Dashboard, Connections, and Alerts. The selected icons are displayed on the Navigation Bar after Menu and Switches in order of selection. An Edit Navigation Bar option allows the user to customize the Navigation Bar, while an Edit Menu Drawer option allows Main Menu customization.

